23.5%
of detection
That is what the overfitting test catches when the overfitting is genuinely severe. If it doesn't fire, that isn't proof your bot is clean — and we say so in the report.
Independent auditingWe do not manage capitalLimits declared
One question: is this a strategy, or is it luck, well presented? And an answer almost nobody publishes: what we could not check.
Real findings
Everything below came out of bots we audited. None of them looked bad on its curve.
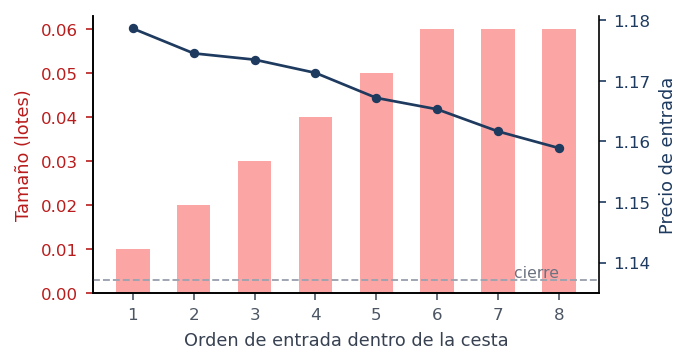
€1,116
What a single martingale basket cost, in a bot whose curve looked spotless.
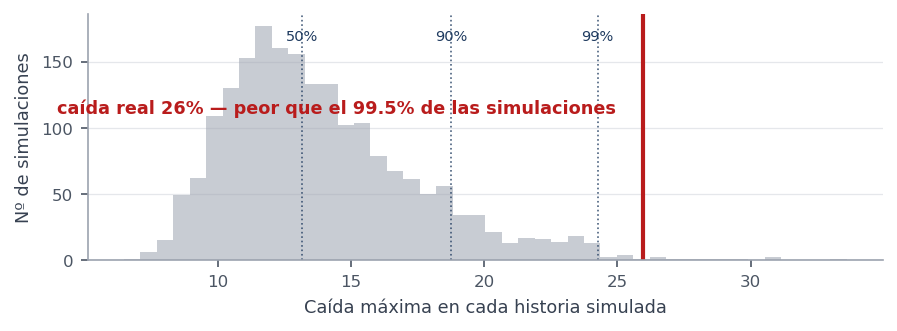
26%
Real drawdown, against the 13 % that half of the alternative histories stopped at.
01The problem
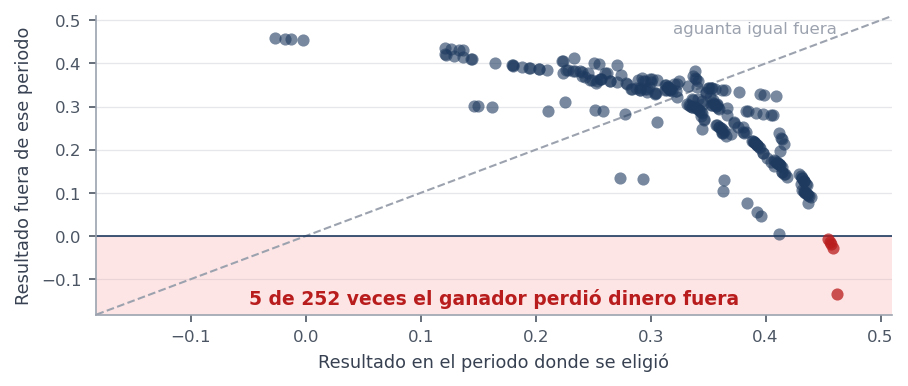
You tried a hundred combinations and kept the best one. That is the sensible thing to do. But across a hundred tries one always comes out good by chance.
That does not show up on the equity curve — the curve only shows you the winner, which is why it always goes up. It has to be measured.
02Disqualifiers
However good everything else is. And if one of them cannot be checked with the data you send, we say so: a rule that was not evaluated is not a rule that was passed.
R-04 · disqualifier
Opening more positions at worse prices to cover one that is going badly. It produces flawless years, then takes the account in four days.
03The order of the losses
We take your trades, shuffle them two thousand times and look at the drawdown the account would have taken in each alternative history. Same trades, same final result, different order.
04Declared limits
Anyone can compute a number. Almost nobody measures how often that number is wrong. These figures come from our own engine:
23.5%
of detection
That is what the overfitting test catches when the overfitting is genuinely severe. If it doesn't fire, that isn't proof your bot is clean — and we say so in the report.
62%
real coverage
An interval advertised as “90 % confidence” is right 62 % of the time when only 5 trades sit in the tail. A narrow interval is not a sign of reliability.
56%
and it doesn't fire
Our martingale detector demands the pattern in 80 % of cases, because it is calibrated against programs. A person averaging down sometimes slips past us. It is measured, and it is declared.
4%
of detection
If you hold two bots and want to know whether they sink together: with the track record they usually share, we would spot a weak dependence 4 times in 100. A strong one we do see. That is why we state how far we reach, instead of handing you a joint-collapse probability we could not defend.
A measurement whose limit is unknown is not a measurement: it is an opinion with decimals.
05Getting started
The statistical certificate comes out of the trade history. Your intellectual property stays with you. The more you send, the more we can measure — and we tell you exactly what each item unlocks before you go to any trouble.
There are three separate files, and you need not send all of them, nor in order: each unlocks its own part. One is enough to start.
The report you saved when a run finished, or the exported list of trades. It is the one almost everybody already has.
Unlocks: risk of ruin, real maximum drawdown, alternative scenarios, concentration of the result, and the position-management pattern.
A CSV that starts with <DATE> <TIME> <OPEN> <HIGH> <LOW> <CLOSE>. Your own platform exports it in a couple of clicks.
Unlocks: the check against the market — whether the prices it claims to have entered at really existed at that moment.
There are two very different options here, and the first costs you nothing.
Unlocks: how many times you really searched, and the probability that your winning configuration is a coincidence.
I already have my files
Attach whatever you have — even if it is only the backtest report — and we write back telling you what coverage we would reach with that and what you would still be missing, before you do any extra work.
Send my filesI don’t know how to get them
Guides with a screenshot of every screen, and a four-line summary at the top for anyone who already knows their way around and would rather not read the whole thing.
See the guides